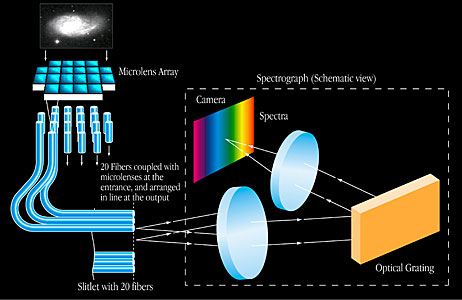
Integral Field Spectroscopy (IFS) is a powerful technique that enables astronomers to study both the spatial and spectral properties of astronomical objects. Unlike traditional spectroscopy, which collects light from a single point or along a slit, IFS captures a complete two-dimensional field of view while simultaneously acquiring spectra for every pixel. This multidimensional data, often referred to as a data cube, provides invaluable insights into the physical, chemical, and kinematic properties of celestial objects like galaxies, nebulae, and star-forming regions.
This article aims to offer a detailed exploration of the IFS technique, its key applications in extragalactic astronomy, and its role in the study of ionized gas, kinematics, and the detection of faint emission line sources. We will draw examples from recent studies, particularly those involving emission line diagnostics and advanced surveys like the MUSE (Multi-Unit Spectroscopic Explorer) project.
What is Integral Field Spectroscopy?
Integral Field Spectroscopy (IFS) is a type of astronomical observation that gathers spectra over a two-dimensional region of the sky. Each pixel in the spatial field of view corresponds to a spectrum, enabling scientists to build a three-dimensional data cube where two axes represent spatial dimensions, and the third axis represents wavelength. This method captures both the spectral and spatial variations within a single exposure, making IFS particularly valuable for mapping extended objects like galaxies and nebulae.
How IFS Works
The data collected in IFS consists of a series of individual spectra for each spatial element (spaxel) within the observed field. These spaxels are then combined into a data cube, which can be used to extract information about the velocity, temperature, chemical composition, and other physical properties across the object. The strength of IFS lies in its ability to offer a comprehensive view of an object’s spectral energy distribution (SED) at multiple points simultaneously.
https://blog.diskdetective.org/2014/02/01/spectral-energy-distributions-seds/
Applications of Integral Field Spectroscopy in Astronomy
1. Mapping Physical Conditions of Ionized Gas
Ionized gas in galaxies plays a critical role in our understanding of stellar formation and galactic evolution. IFS allows for precise mapping of the electron density, temperature, dust content, and metallicity (chemical abundances) in these regions.
Electron Density
The electron density in ionized gas can be diagnosed using specific emission lines. Two of the most widely used lines for electron density diagnostics are:
[O II] λλ3729, 3726
[S II] λλ6731, 6716
These lines are excited by electron collisions, and their intensity ratios depend on the density of the gas. At low densities, the line ratios reflect the statistical weights of the excited states, but at higher densities, collisional de-excitation becomes significant.
Using tools like Pyneb, astronomers can perform detailed calculations of electron density by solving equations based on velocity-averaged collision strengths. Pyneb calculates the probability that an electron collision will cause an ion to be excited or de-excited, providing key insights into the physical conditions within galaxies.
Example: NGC 232 and UM 462
Studies of galaxies such as NGC 232 and UM 462 have used IFS data to map variations in electron density across different regions of these galaxies. These variations provide insights into the ionization conditions and the structure of the gas.
Dust Content
Dust plays a significant role in shaping the observed properties of galaxies, especially in the optical wavelengths. Dust particles absorb and scatter light, causing extinction that can alter the appearance of emission lines and continuum radiation. IFS allows astronomers to construct detailed extinction maps that show how dust is distributed across a galaxy.
The difference between observed flux and intrinsic flux (what we would observe in the absence of dust) helps in measuring dust extinction. The Balmer decrement, which is the ratio of Hα to Hβ lines, is a common method to quantify dust extinction. By comparing the observed line ratio to the intrinsic ratio (typically 2.86 for the interstellar medium), astronomers can calculate the amount of extinction and map the dust content.
Example: Haro 11
In galaxies such as Haro 11, extinction maps created from IFS data help in identifying dust-rich regions and understanding the impact of dust on star formation and gas dynamics.
Electron Temperature
The electron temperature in ionized gas is another fundamental property that can be determined using specific temperature-sensitive emission lines. For example, the ratio of certain [S III] lines provides a robust diagnostic of electron temperature. This temperature diagnostic helps astronomers probe the thermal conditions within ionized gas regions.
Example: UM 462 and Haro 11
Temperature maps for galaxies like UM 462 and Haro 11 reveal the thermal structure within ionized gas regions, helping researchers to understand how the energy is distributed across these regions.
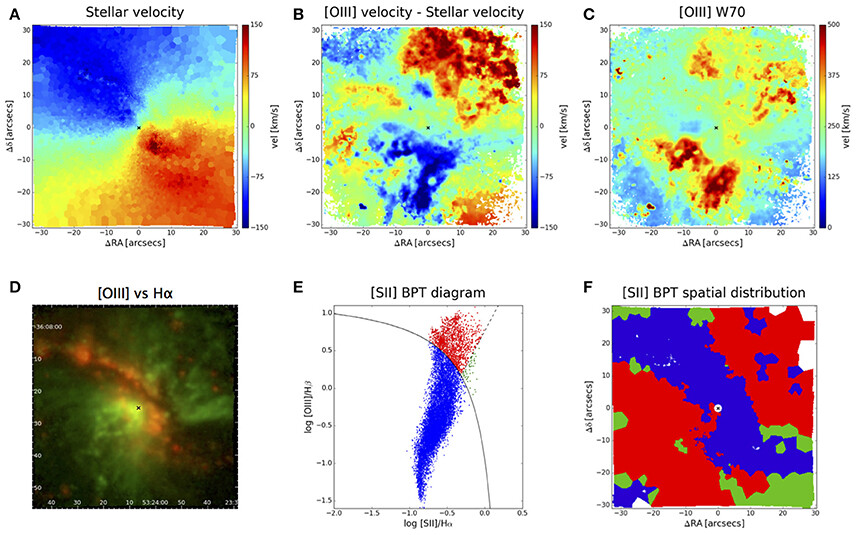
2. Mapping Kinematics of Ionized Gas
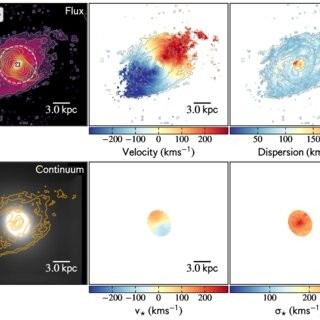
Understanding the motion of ionized gas within galaxies is crucial for studying galaxy dynamics, feedback processes, and interactions with surrounding environments. IFS is an excellent tool for creating detailed maps of gas velocities and velocity dispersions across galaxies.
Parametric Approach: Gaussian Fit
One common method of analyzing gas kinematics involves fitting a Gaussian profile to emission lines in the IFS data cube. The velocity of the gas can be determined from the central wavelength of the Gaussian fit, while the width of the Gaussian provides information on the velocity dispersion. Velocity dispersion is a measure of how spread out the velocities are within the gas, giving insights into turbulent motions or interactions with other gas clouds.
Moment-based Analysis
Another approach to analyzing gas kinematics involves calculating moments from the emission line profiles:
First Moment: Represents the mean velocity along the line of sight.
Second Moment: Indicates the line width, related to velocity dispersion.
Third Moment (Skewness): Describes asymmetry in the velocity distribution.
Fourth Moment (Kurtosis): Highlights the sharpness of the velocity distribution and any tail structures.
Example: Velocity Maps
Velocity maps generated from IFS data allow astronomers to visualize the motion of gas across a galaxy. These maps often reveal patterns of rotation, outflows, or inflows of gas, providing a window into the dynamics of the galaxy.
3. Detecting Faint Emission Line Sources
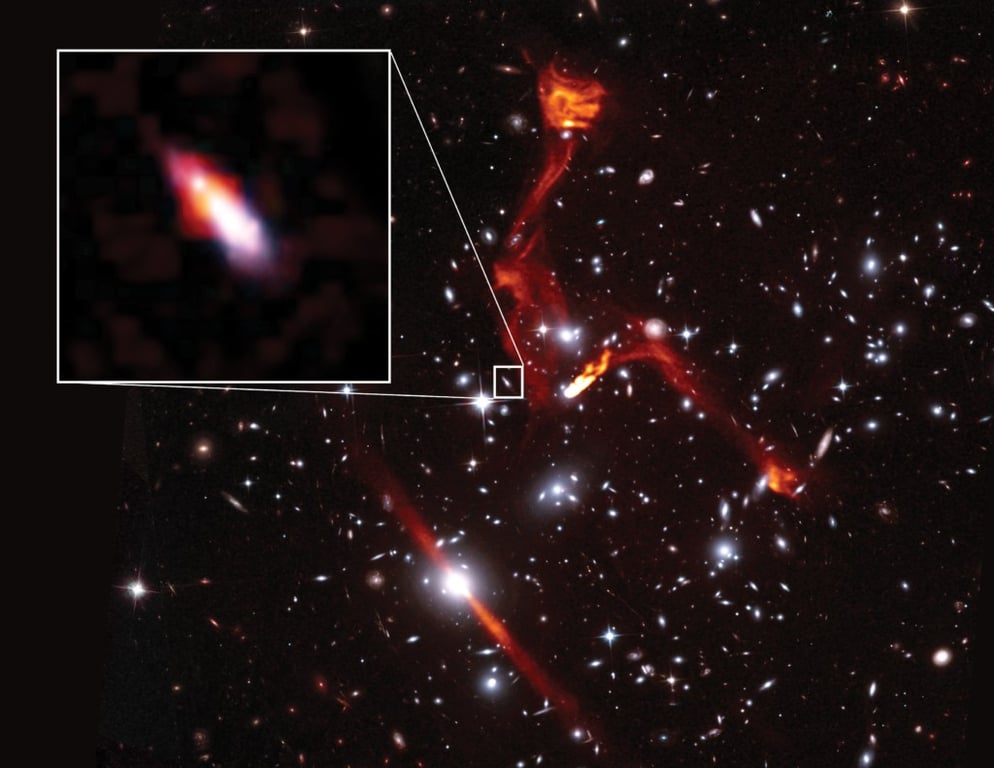
https://public.nrao.edu/news/cosmic-lens-reveals-faint-radio-galaxy/
Detecting faint emission line galaxies is a key challenge in extragalactic astronomy. Modern IFS surveys like MUSE-Wide, MUSE-Deep, and MUSE-Ultra Deep are designed to address this challenge. These surveys capture spectral data over wide fields, providing a rich dataset for discovering faint galaxies and emission line sources that might otherwise go undetected.
Matched Filter Approach
A common method for detecting faint sources in IFS data is the matched filter approach. This method involves hypothesis testing, where the null hypothesis assumes that no source is present. A matched filter is applied to maximize the detection of a source by correlating the data with a template that matches the expected signal profile.
LSDCat Software
Developed by Herenz and Wisotzki, the LSDCat (Line Source Detection and Cataloguing Tool) implements the matched filter approach to detect faint emission lines in IFS data cubes. It produces a signal-to-noise ratio cube that highlights potential emission line sources, making it a valuable tool in large IFS surveys.
Conclusion
Integral Field Spectroscopy is a transformative technique in modern astronomy, providing astronomers with an unparalleled view of the spatial and spectral characteristics of galaxies and other celestial objects. Through IFS, researchers can map physical conditions like electron density, dust content, and electron temperature; probe the kinematics of ionized gas; and detect faint emission line galaxies that were previously inaccessible with other methods.
https://www.eso.org/public/teles-instr/technology/ifu/
As large-scale IFS surveys like MUSE continue to expand our knowledge of the universe, the future holds exciting prospects for the study of galaxy formation, evolution, and the intricate processes that govern the behavior of ionized gas in different cosmic environments. Whether it’s uncovering the hidden dynamics of galaxies or mapping the elusive dust that shapes their appearance, IFS remains at the forefront of astronomical research.
References:
Herenz, Edmund Christian, and Lutz Wistozki. "LSDCat: Line Source Detection and Cataloguing Tool." Astrophysics Source Code Library (2016): ascl-1612. | doi: https://doi.org/10.1051/0004-6361/201629507
Luridiana, Valentina, Christophe Morisset, and Richard A. Shaw. "Pyneb: a new tool for analyzing emission lines-i. code description and validation of results." Astronomy & Astrophysics 573 (2015): A42. | doi: https://doi.org/10.1051/0004-6361/201323152
Urrutia, T., L. Wisotzki, Josephine Kerutt, K. B. Schmidt, Edmund Christian Herenz, J. Klar, Rikke Saust et al. "The MUSE-Wide Survey: survey description and first data release." Astronomy & Astrophysics 624 (2019): A141. | doi: https://doi.org/10.1051/0004-6361/201834656
Akras, S., H. Monteiro, J. R. Walsh, J. García-Rojas, I. Aleman, H. Boffin, P. Boumis et al. "Spectroscopic analysis tool for intEgraL fieLd unIt daTacubEs (satellite): case studies of NGC 7009 and NGC 6778 with MUSE." Monthly Notices of the Royal Astronomical Society 512, no. 2 (2022): 2202-2221. | doi: https://doi.org/10.1093/mnras/stac632